Stress within the
Personal Exposome

Why A&S Focuses on Stress

Stress is a key influencing factor within the personal exposome—shaping how external exposures are perceived, integrated and translated into biological responses.

Scent, diet, sleep, lifestyle and environmental exposures can influence emotions, metabolism, immunity, skin health and aging through sensory and neural pathways.

By integrating sensory science, exposome research, Bio-Responsive Ingredients, Scented Therapy and Neuro Skincare, A&S explores how the body perceives, regulates and recovers from stress—and translates these insights into meaningful products and services.

Our goal is not to eliminate stress, but to help the body adapt, restore balance and build long-term resilience.

Human profile illuminated by neural connections and sensory signals

The Four Stages of Stress

From Adaptive Response to HPA-Axis Dysregulation

What the Blue Curve Represents

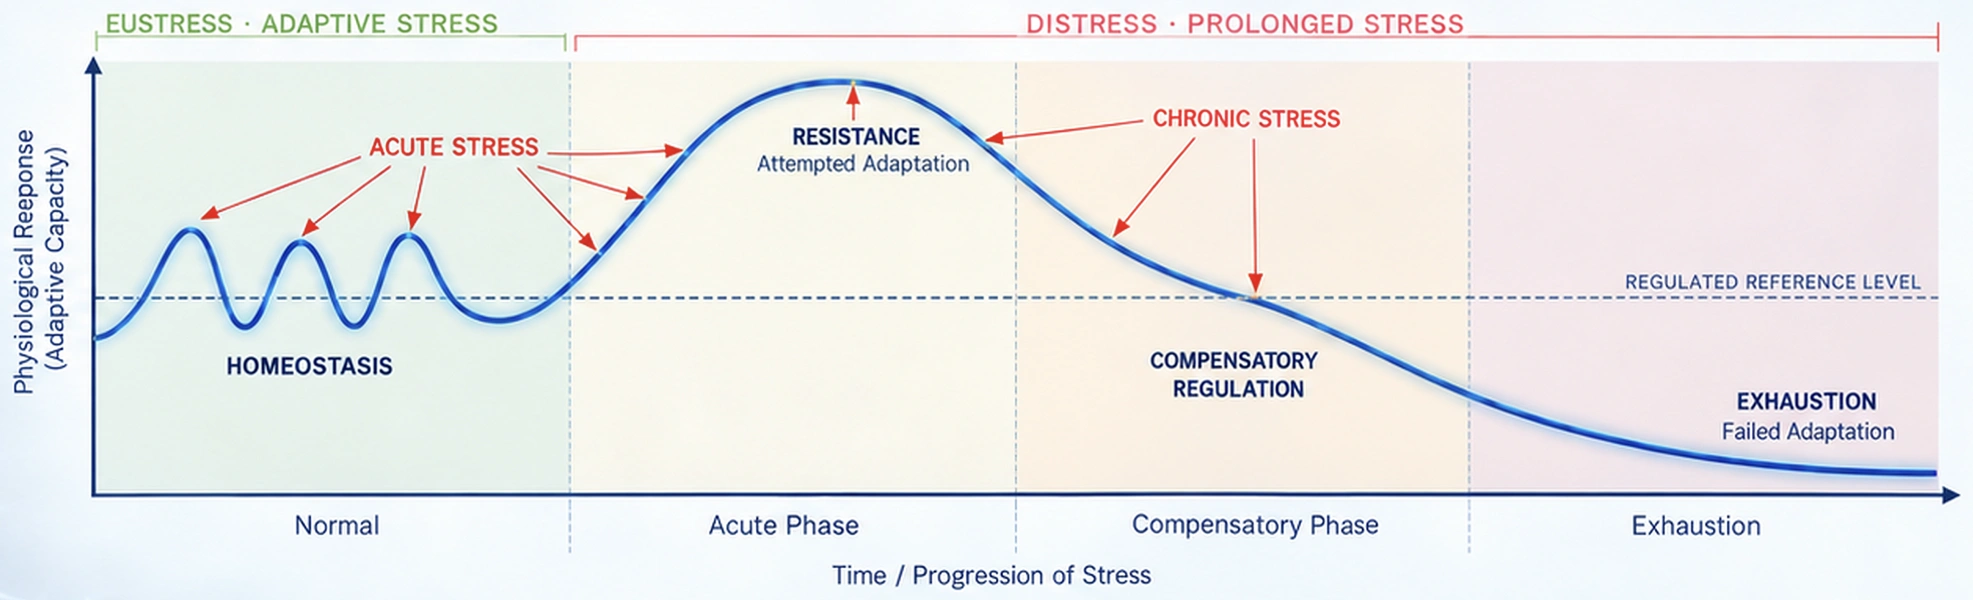
The blue curve represents the body’s adaptive capacity and physiological stress response, including HPA-axis activity and mediators such as cortisol.

Normal responses fluctuate and recover. Acute stress drives resistance; prolonged stress weakens compensation, eventually leading to exhaustion and impaired regulation.

  1. Calm woman with blue neural pathways illustrating normal adaptation

    Homeostasis (Normal)

    Successful Adaptation

  2. Alert woman with activated neural pathways illustrating acute stress

    Acute Phase

    Resistance · Attempted Adaptation

  3. Woman with blue and gold neural activity illustrating compensation

    Compensatory Phase

    Attempted Adaptation

  4. Weary woman looking downward illustrating exhaustion

    Exhaustion

    Failed Adaptation

Conceptual curve of physiological response over time: normal homeostasis fluctuates and recovers around a regulated reference level; acute stress rises to resistance; compensatory regulation declines during prolonged stress; exhaustion falls below the reference level. Eustress denotes adaptive stress; distress denotes prolonged stress. No numeric scale is assigned.
Conceptual Stress Adaptation & Physiological Response Curve

Scroll horizontally to view the full curve.

Acute-to-Chronic Stress Transition

Recovery Determines the Path

Acute stress supports adaptation when recovery is complete. Repeated or unresolved stress accumulates allostatic load, progressively weakening regulation and resilience.

Woman with illuminated brain and neural pathways illustrating the stress response

Stress Exposure

Psychological · Physical · Social

Acute-to-Chronic Stress Transition

Was Recovery Complete?

Yes

  1. Recovery
  2. Homeostasis Restored
  3. Resilience

No

  1. Repeated Stress /
    Incomplete Recovery
  2. Allostatic Load Accumulation
  3. Persistent DysregulationSensitization / RecurrenceBack to Stress Exposure
  4. Chronic Stress
Acute-to-Chronic Stress Transition

Core Dysregulatory Systems

Chronic Stress–Induced Dysregulation Across Multiple Systems

Chronic stress can disrupt several regulatory systems simultaneously. These systems reinforce one another, allowing dysregulation to persist and intensify over time.

Oxidative & metabolic dysfunction is the central driver that amplifies and links all core dysregulatory systems.

  1. Brain showing the illuminated hypothalamic-pituitary pathway

    HPA Axis Dysregulation

    • Impaired feedback
    • Blunted cortisol rhythm
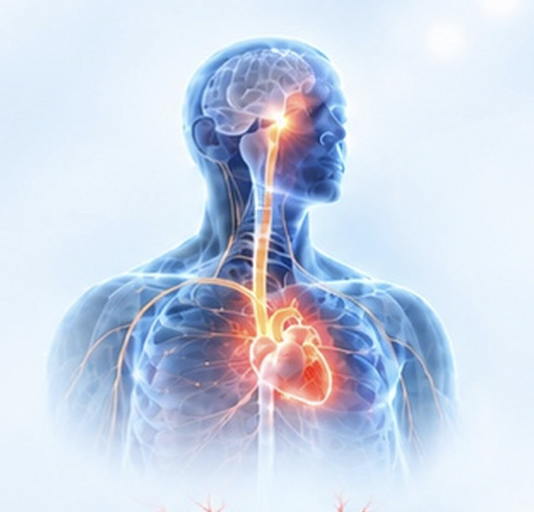
  2. Autonomic nervous system connecting the brain, spinal cord and heart

    ANS (SAM–ANS) Overactivation

    • Sympathetic dominance
    • Reduced parasympathetic tone
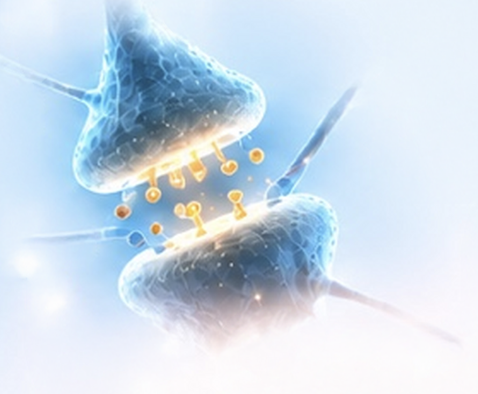
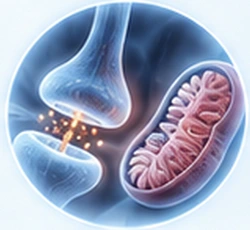
  3. Neurotransmitters crossing a synaptic junction

    Neurotransmitter Dysregulation

    • NE, 5-HT, DA imbalance
    • Glutamate–GABA imbalance
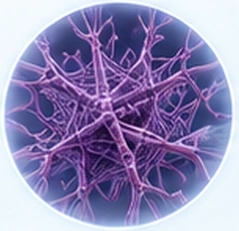
  4. Activated microglial cells with inflammatory signaling

    Neuroinflammation & Impaired Neuroplasticity

    • Microglial activation
    • BDNF ↓, reduced plasticity

Reciprocal Interactions

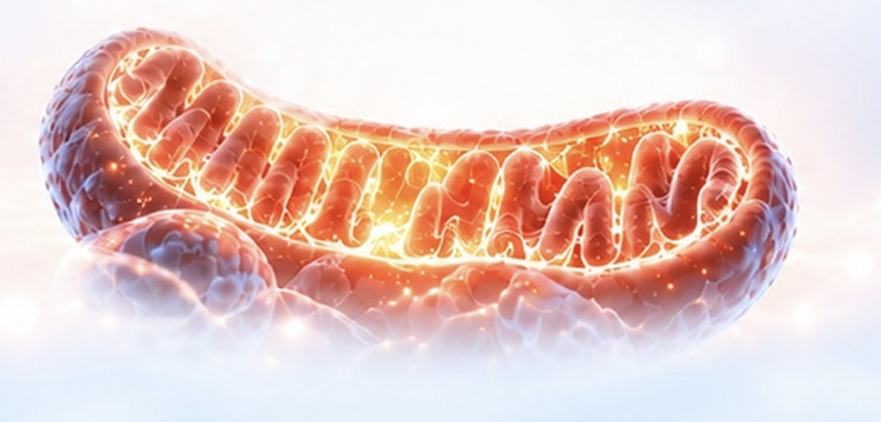
Illuminated mitochondrion illustrating oxidative and metabolic dysfunction

Oxidative & Metabolic Dysfunction

Foundation & Amplifier

  • Oxidative stress (ROS ↑)
  • Mitochondrial dysfunction & metabolic inflexibility

Disease Vulnerability & Clinical Outcomes

From Persistent Dysregulation to Broader Health Vulnerability

Persistent stress-related dysregulation can increase vulnerability across both mental and systemic health domains. Shared inflammatory, neuroendocrine, autonomic and metabolic mechanisms connect these outcomes.

Repeated or prolonged stress can amplify vulnerability through accumulating allostatic load and persistent neurobiological change.


Mental & Neuropsychiatric Disorders

  • Mood & Anxiety Disorders

    Strong
  • PTSD / Stress-Related Disorders

    Strong
  • Sleep Disorders

    Moderate
  • Substance Use Disorders

    Moderate
  • Skin Disorders

    (e.g., eczema, psoriasis, acne)

    Moderate


Connecting Mechanisms

  • Chronic Inflammation
  • HPA Axis Dysregulation
  • Neuroimmune Interactions
  • Autonomic Imbalance
  • Oxidative & Metabolic Stress

Systemic & Metabolic Vulnerability

  • Cardiometabolic Disease

    Strong
  • Metabolic Dysfunction

    Strong
  • Immune / Inflammatory Dysregulation

    Moderate
  • Cognitive Decline

    Moderate
  • Liver & Gut Dysfunction

    Moderate

From Chronic Stress to Neurodegeneration

The Extended Pathway from Allostatic Load to Dementia Risk

Chronic stress does not determine neurodegeneration. Risk may increase when persistent dysregulation, allostatic load and neuroinflammatory–metabolic stress converge over time.

Progression is heterogeneous—not everyone follows this pathway.

  1. Chronic Stress Exposure

    Persistent stress · Incomplete recovery

    Woman holding her forehead, illustrating persistent stress
  2. Core Neurobiological Dysregulation

    HPA / ANS · Neurotransmitters · Neuroinflammation
    Oxidative & mitochondrial stress
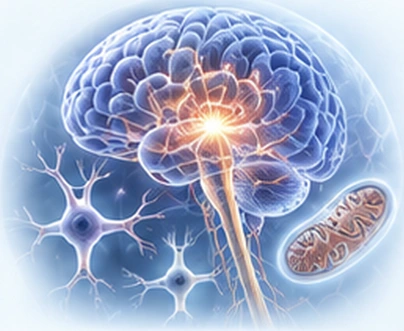
    Illuminated brain, neurons and mitochondrion illustrating interacting dysregulatory systems
  3. Disease Vulnerability

    Mental · Systemic · Cognitive

    Brain profile and whole-body anatomy illustrating mental, systemic and cognitive vulnerability

Stress sensitization Greater allostatic load Persistent neurobiological change

Progressive Cognitive Vulnerability

  1. Young adult profile showing the brain and neural pathways

    Cognitive Risk

  2. Adult profile with illuminated brain regions

    Subjective Cognitive Decline

  3. Older adult profile with highlighted brain regions

    Mild Cognitive Impairment (MCI)

  4. Older adult brain profile illustrating increased dementia risk

    Increased Dementia Risk

Many factors influence the trajectory—not everyone progresses.
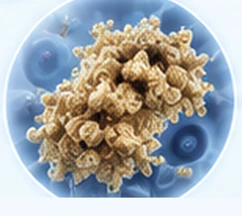
Neurodegeneration — Endpoint Pathway

  • Amyloid-beta protein accumulation

    Amyloid-β Accumulation

  • Tangled tau protein illustration

    Tau Pathology

  • Microglial cell illustration

    Microglial Dysregulation

  • Synaptic junction and mitochondrion

    Synaptic & Mitochondrial Dysfunction

Brain showing neuronal loss and atrophy in the endpoint pathway

Neuronal Loss & Brain Atrophy

Dementia / Alzheimer’s Disease